
Fertigo
A fertilizer purchase platform optimized for the row crop farmer's needs.
PROBLEM STATEMENT:
How might we better assist farmers in their purchase decision of fertilizers to increase yield effectively, return on investment, and intuitively improve their soil's health using sustainable and socially benefiting practices?
SOLUTION
A fertilizer purchase platform optimized for the row crop farmer's needs. A first-of-its-kind service providing cost-effective fertilizer purchases, customized to meet the individual farmer's needs.
Core values of Fertigo:
•Providing the right fertilizer at the right time through Just In Time delivery (JIT).
•Customizable Fertilizer plans that fit with the fertilizer map generated through farm software ensure an increase in Yield.
•Our opaque pricing model ensures quality fertilizers within budget.
•Provides downstream fertilizer compliance report.

This project was part of the producer-led Agtech Innovation Challenge hosted by Agrinovus Indiana in 2020.
Project Details
My Role - UX Researcher, UX Designer, & Product Manager
Project Duration - 4 Months
Team Name - Informatica Ranch
Mentor - Lou Lenzi, Professor of Practice at Indiana University
Team Members - Four designers and two data scientists
What was my task/work?
The project was divided into four phases, Research Phase, Ideation Phase, Business model development Phase, and Prototyping Phase.
As a Product Manager, my role was to participate in all project phases actively, make timelines, schedule zoom calls, communicate design deliverables to the Data Scientists, and lead the Business Development Phase along with designing the roadmap to commercialize Fertigo.
As a Product Designer, I collaboratively worked with the designers from the research phase to the prototyping phase. I individually worked on desk research, sketching design concepts, user flow, and wireframing.
Tools Used:
Design - Figma, Adobe XD
Collaboration & Brainstorming - Miro, Mural, Google Docs
Communication - Slack, Zoom, Outlook
Key Features
Easy data integration from existing reports
Farmers get data in the format of .json and. XML from farm-tech IoT sensors, analytical software, and soil sampling. Fertigo automatically fetches the required data from those files, so that farmers don’t have to manually type in data from huge spreadsheets.
Easy to use on the go Fertigo mobile app.
Once the farmer completes the onboarding and uploads all the documents on the web application, the farmer can use the mobile app to set reminders about the fertilizer purchase, get notified if there is a considerable price drop, and get tips on fertilizer application throughout the season.
Marketplace allows farmers to buy the fertilizer at their desired rate.
Fertigo's marketplace follows an opaque pricing model similar to Hotwire and Priceline. The fertilizer retailer's company name is hidden to offer fertilizers at the buyer's asking price.

The Challenge
Modern farming requires data management that includes data collected from the sensors installed in farms and other sources like accounting, inventory, and other complex production data.
Instead of seeing insights across a farm, producers look at data pieced together from a complex network of farm-specific software and consumer software such as Microsoft Excel and Google Sheets.
Suggested Parameters to Consider:
1.) Reduce manual data entry (typically conducted in Microsoft Excel, Google Sheets, or similar) by automating data aggregation from farm operating systems.
2.) Make it possible to quickly validate data quality (examples: field-level information, seed inventory, accounting entries, etc.)
3.) Automate alert notifications based on farmer-defined standards and user roles.
4.) Visualize data to quickly and easily make informed decisions.
We worked on a task list, looking at the challenge brief:
We have to address one or all of the farmer/producer-defined suggested parameters efficiently.
We have to develop a solution that integrates with current farm technologies.
We have to clearly articulate the benefits of the solution to the farmer/producer.
We have to build a road map to commercialize the solution in 2021.


Design Process
Research Phase
To deep dive into the given challenge, we divided the research phase into desk research and field research.
Ideation Phase
In this phase, we defined the problem space and the stakeholders. Further, we came up with the idea of Fertigo.
Business Model Phase
In this phase, I developed the business strategy for Fertigo and the roadmap to commercialize Fertigo in 2021.
Prototyping Phase
Here we created the user flow, low-fidelity paper prototype, wireframes, and high-fidelity prototype
Research Phase
Before starting the research phase, we had these two big problems to face:
We did not know the farming practices, farming trends, and farming tech trends.
We had no specific Problem Space.
These questions gave us a direction to start our research. We divided the research into two phases and started working parallel on:
Desk Research
Field Research

Desk Research
Defining the Customer:
As the challenge was held in Indiana and catered to resolve the farmers' problems in Indiana and the Mid-west, I decided to focus on the producer from Mid-west.
U.S. Feed Grain Production in 2020/21
Crops grown in Midwest
As the majority of the crops grown are row crops like Corn and Soybeans.
Our Target Customer: Row-crop farmers of Midwest
The next step was to identify the steps involved in growing Corn and Soybeans to empathize with our target customer. Also, identify the technology and data collection opportunity at each stage.
Current Agritech practices used by the target customers:
Internet of Things (IoT)
Smart sensors integrated into the existing farming process monitors and genrates precision data for daily decision making.
Smart Farming
Smart farming is a holistic approach that uses cloud-based software and automation tools to connect data from IoT devices and provide specific insights. The specific insights help in improving yield and farm stewardship.
Drones & Satellites
Drones and satellites measure, monitor, scenes data and takes the imagery of the farm with the use of devices such as hyperspectral cameras mounted on drones. This imagery helps in identifying the parts of the farm that are best suited for planting and producing high yields. This method is also known as Precision Farming.
Robotics & Automation
Advanced robotics and automated machinery help in increasing farming efficiency, saving cost, and increasing yield. For example, automated irrigation systems optimize both crop growth and water usage.
Big Data & AI
Using sensor -recorded weather conditions, changes in soil structure, and crop efficiency, Big Data & AI can optimize almost every aspect of crop management.
BioTech Adopting various BioTechs, such as gene editing and 3D Bioprinting to improve the adaptability of seeds and the fertility of the soil. For example, technologies & biological algorithms build crops capable of battling weeds and insects.

Identifying the process involved in growing a row-crop like Corn and Soybean.

Field Research
Due to COVID, all the meetings and User Interviews were conducted through Zoom calls. The following individuals provided valuable user insights through a series of 45-minute interviews conducted throughout the challenge period:

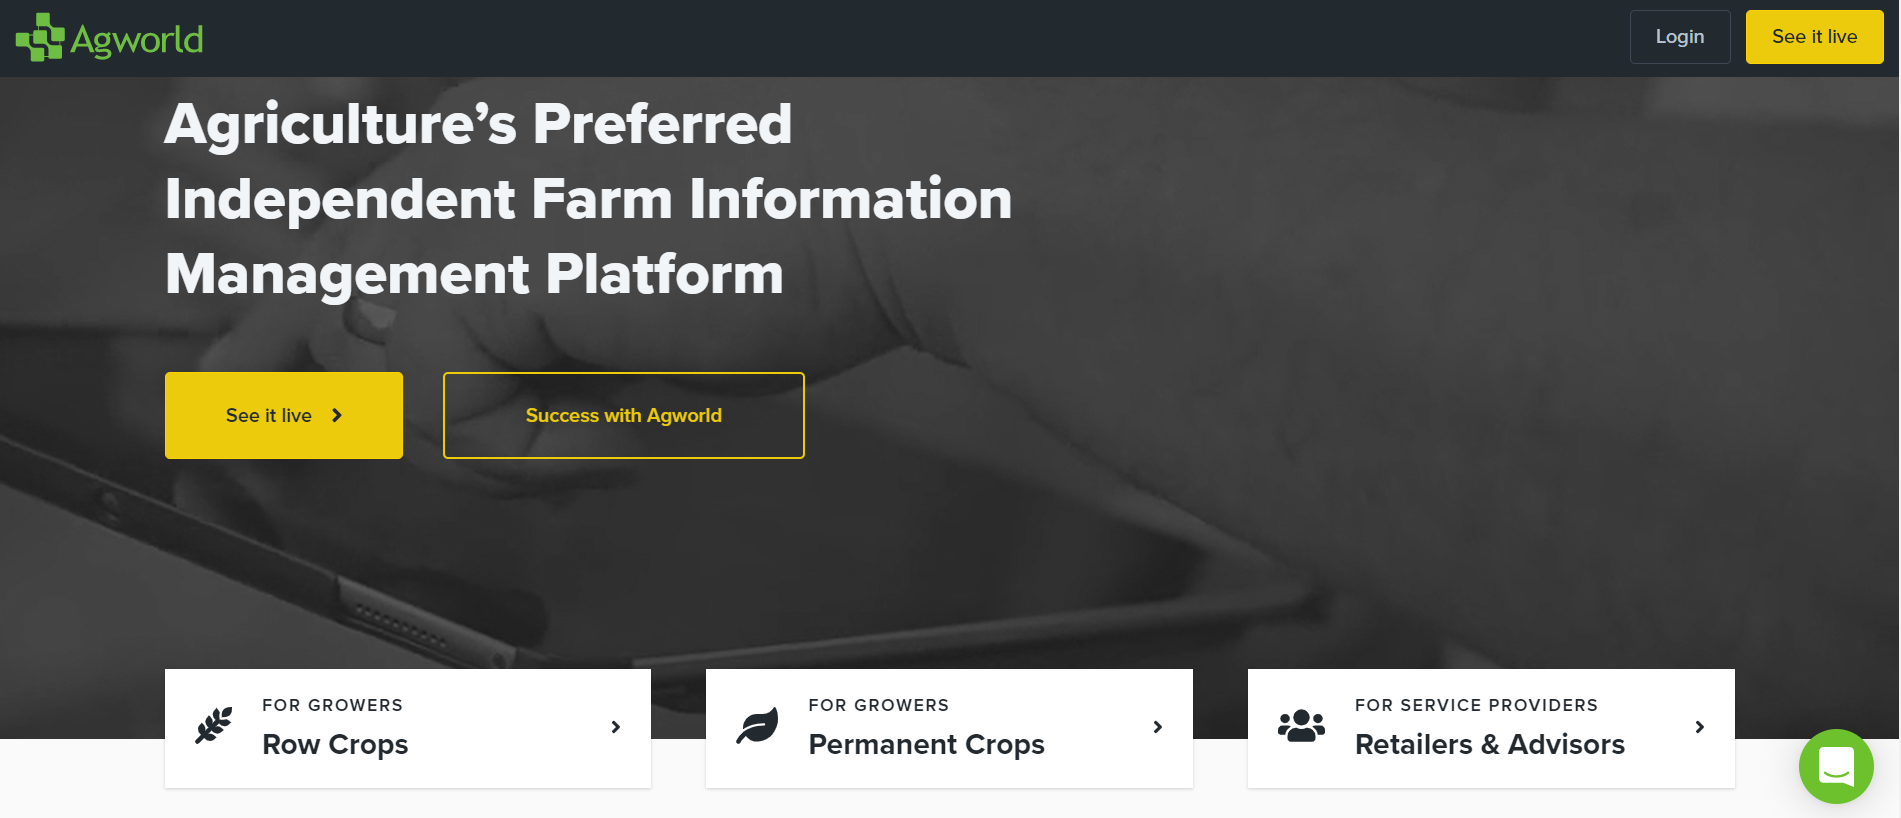
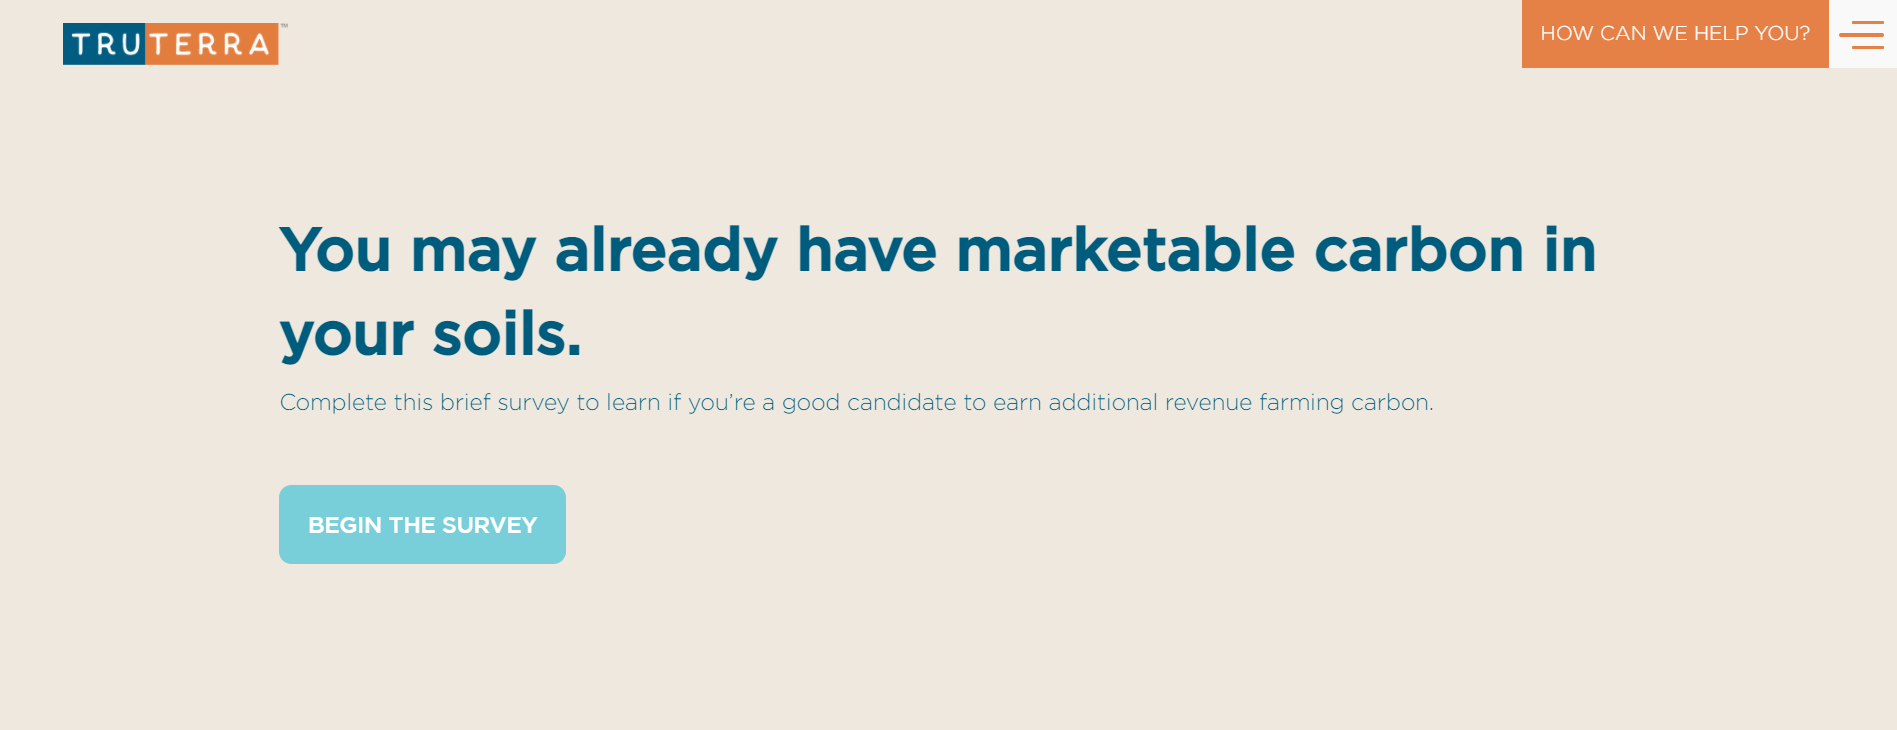
Through the user interviews, we found out that the Midwest row crop farmers have an established ecosystem of farm analytics software that they use for data analysis and management. Softwares like Trueterra, Agworld, and farm stewardship software like Data Silo.
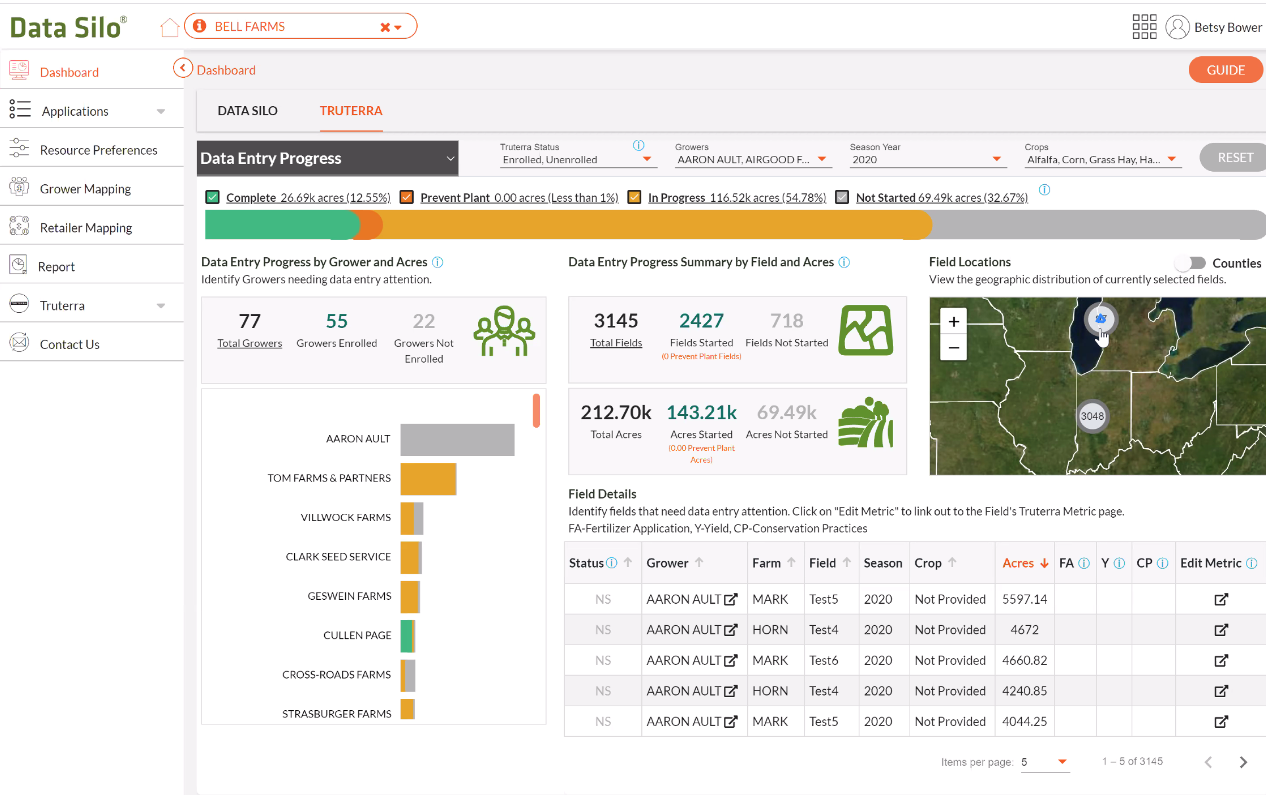


Farmers heavily rely on the insight score generated by the agtech software. This insight score shows the quality of farm management and also describes the yield potential.
Screenshot of Trueterra insights engine.
How is the insight score generated?
How to improve the insight score?
Farm-tech software takes different parameters like:
Soil Samples
Tillage practices,
Pest Management
Irrigation
Soil Quality
Soil Conservation practices
Nitrogen use efficiency
Fertilizer application timing
After taking in all the parameters, the software runs the simulation and provides insight scores that show how well maintained the farm is and what needs to be done to increase the insight score.
The crucial parameter and most comfortable thing to do is change Nitrogen, Potash, or Phosopohorus quantity in the soil to increase the insight score. Improving the quality of the fertilizers, using the right fertilizers at right time, and making a budget for the fertilizers throughout the season is crucial in the application of the fertilizers.
Here some questions arose:
How is the fertilizer currently purchased?
How is the fertilizer delivered to the farmer?
How do the farmers pay for the fertilizers?
How does the farmer calculate the quantity of fertilizer needed according to the budget?
Do the farmers report the purchase of the fertilizer to the government.
Are there any government subsidies that incentives sustainable fertilizer practices?
How are the purchase alerts made?
How does the farmer buy fertilizer in the case of urgency?
Through our series of user interviews, we were able to crack the ecosystem of technology used by the row-crop farmers of Mid-West to generate a fertilizer map that they can use to enhance their soil quality and increase their yield.
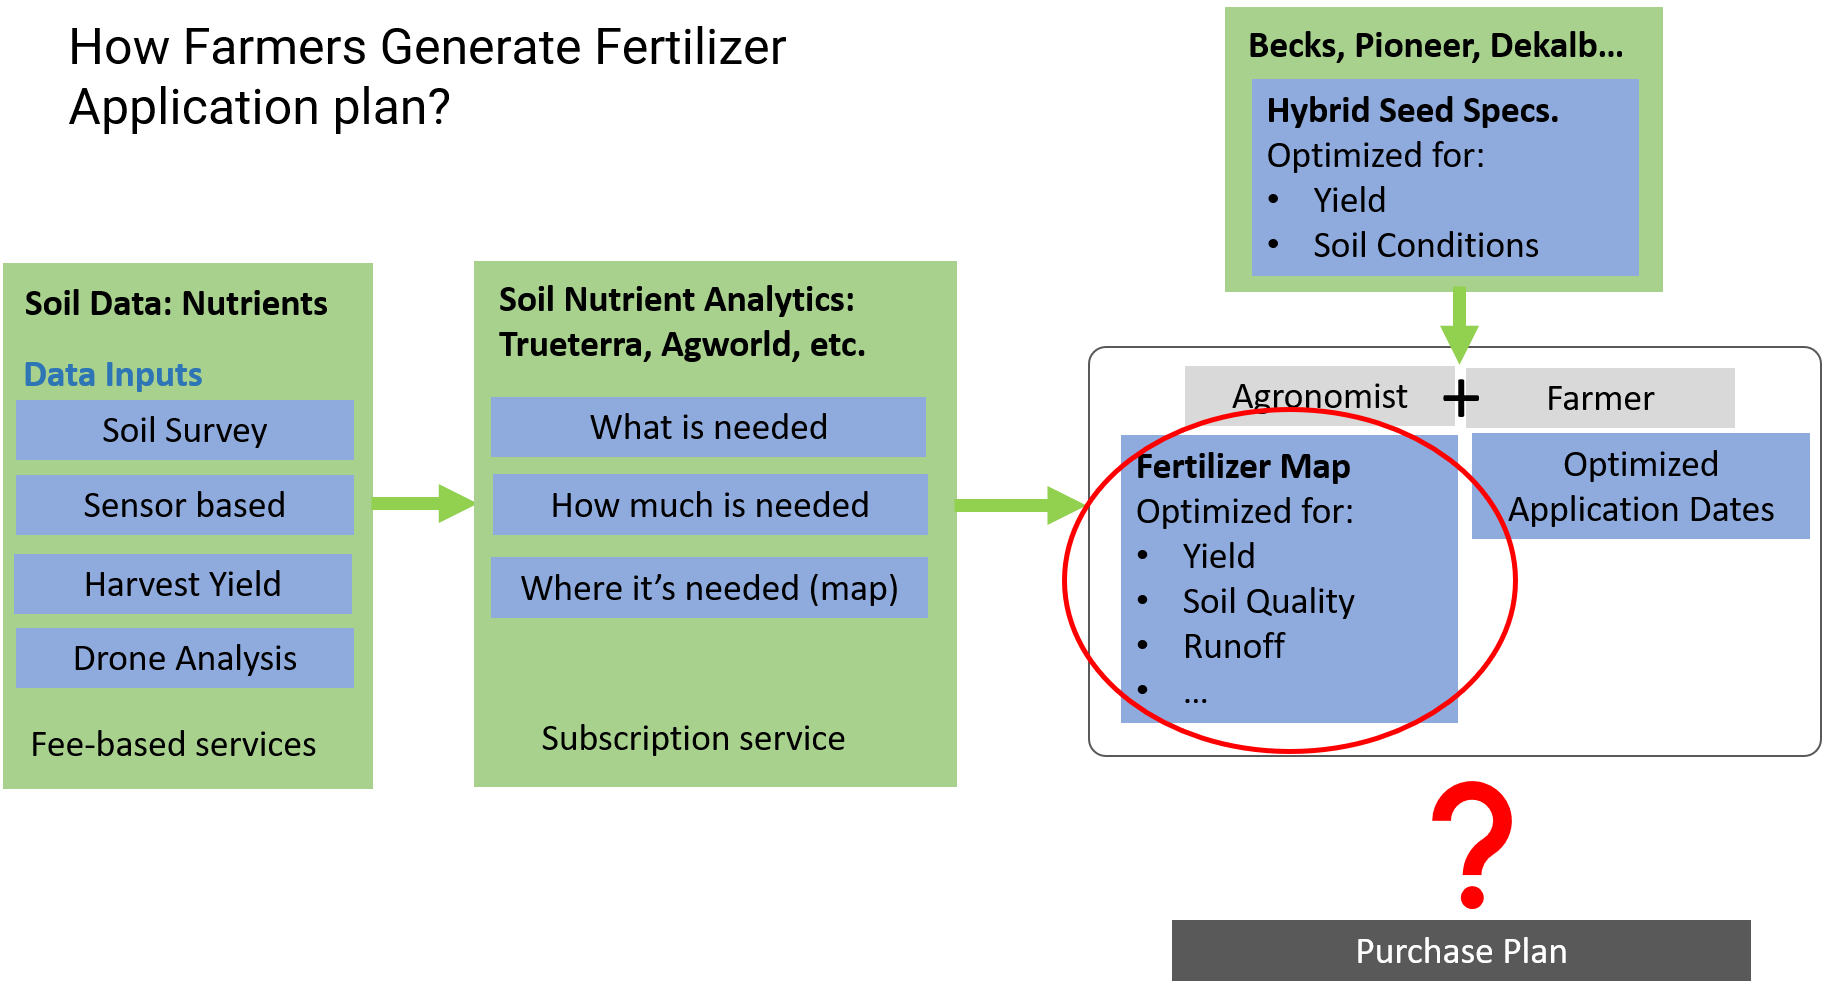
In this ecosystem, the farmers are able to generate a fertilizer application plan but not a fertilizer purchase plan.

Ideation Phase
Now it was time to put all the puzzle pieces together and come up with a :
Problem Space
Solution
As we entered the ideation phase we had a direction to work on. Our goal was to deep dive into the problem of purchasing fertilizer for row crop farming.
Market overview of Fertilizers
Why Fertilizer purchase is a problem?
Identifying the Stakeholders
Identifying jobs of the Stakeholders
Identifying pain points of Stakeholders
Identifying the gains for Stakeholders
Creating the Problem Space
Fertilizer price averaged about $66 per acre for corn will average about $137 per acre of corn.
Soybean fertilizer prices rose by 207% since 2005.
United States Fertilizer Market is projected to register a CAGR of 1.8% during the forecast period 2020-2025.
It presents a great business opportunity in this growing market.
Fertilizers increase in price due to specific problems like:
Farmers are holding their decision to buy fertilizer. Retailers don't know about the farmers' needs as supply is more significant than demand; there is increased fertilizer price.
Due to budget issues, farmers are holding on using fewer fertilizers that improve soil's nutrition level. Cutting down prices is a short term gain but a long term pain as it affects the yield.
Historical price patterns suggest price increase and not price declines.
It is challenging to predict fertilizer prices as they vary and depend on factors such as energy costs and crude oil prices.
Brent crude oil prices recently reached $80 per barrel, the highest level since 2014. As always, the energy outlook is uncertain, with possibilities of larger price movements.
In 2019, most corn acres got washed away, and farmers geared up to cover up in the next season and projected to plant around 95 million acres of corn to replenish domestic inventory and take advantage of a bounce in grain prices.
This has led to an increasing Urea's price as dealers began stocking up for spring demand.
The two stakeholders:
Target Customer (Farmer)
Fertilizer Seller/Retailer
How might we better assist farmers in their purchase decision of fertilizers to increase yield effectively, return on investment, and intuitively improve their soil's health using sustainable and socially benefiting practices?

Persona
To empathize with the target customer, identify pain relievers, identify gain creators, and identify the values that will reflect in the solution.
Identifying the process that Fertigo will follow to solve the problem space:

This is how Fertigo fits in the existing ecosystem

The Process
Existing software such as TrueTerra guides the Farmer about the nutrition needed to improve their insight score. For example, Side Dress, Improving the PH level of the soil, adapting soil conservation methods.
The data from TrueTerra type software and their selected hybrid seed will go to the Farmer and Farmer's Agronomist to generate a Fertilizer Map.
Informatica Ranch application will take in the Fertilizer Map along with data like Farmer's budget, any fertilizer currently in their inventory, Yield result of the current season, and their forecasted yield for the upcoming season.
Based on the above fertilizer requirements for the upcoming season, Informatica Ranch will act as a fertilizer broker, requesting bids for the best fertilizer deal according to the budget, visualize the data in an understandable format, and make purchase recommendations.
Mapping out the Process to go into the Business Model Phase
Business Model Development Phase
To create a roadmap to commercialize Fertigo in 2021, I worked on identifying the values that are created for the stakeholders through our services.

Identified the Gain Creators for the stakeholders:
Identified the Pain Relievers for the stakeholders:
Next, I started filling up the Business Model Canvas to create the roadmap for commercializing Fertigo.
How Fertigo delivers service to the target customer?
Awareness
Advertisements
Reaching out to customers and provide discounts
Purchase
Easy to use Fertigo Web and Mobile application
Delivery
Just In Time(JIT) delivery by our third-party partner
How Fertigo creates a good relationship?
Evaluation
Feedback on buying and delivery experience
Feedback on the delivery experience
After Sales
Fertilizer application and purchase notifications
Alerts about discounts
On – time compliance report and other services
How are we providing the service after they have registered at Fertigo?
Service Blueprint represents how Fertigo maintains relationship with the farmer through out the growing season.
How Fertigo generates revenue?
Through our Opaque Pricing Model.
2 – 5% commission on fertilizer sales.
Data Monetization of fertilizer sales.
How does the opaque pricing model work?
How to activate the services of Fertigo?
Key Activities
Fertigo Farmer App
Fertilizer Bid App.
JIT Delivery Logistics
Fertigo Service Mktg & Promotion
Key Resources
R&D
Designers & Dev
Soil Scientist
Data Scientists
Database Developers
Copyright
Licenses
Business Development
Marketing & Sales
Who will be Fertigo’s Key Partner?
Fertigo Sales:
Fertigo Vendors
Just In Time, on-demand delivery:
Roadie - A crowdsourced delivery company
Why Roadie?

image source: https://www.roadie.com/enterprise
How Just In Time, on-demand delivery works?
Cost to create Fertigo and it’s services:
Delivery Partner Fees
IT Agency and Hosting Fees
Marketing Agency Fees
Licensing and Copyright
Ad Placement Fees
FTE Salaries
Prototyping Phase
We started the prototyping phase by clearing out the user flow.
The second iteration of the user-flow

Low-Fidelity Paper Prototype


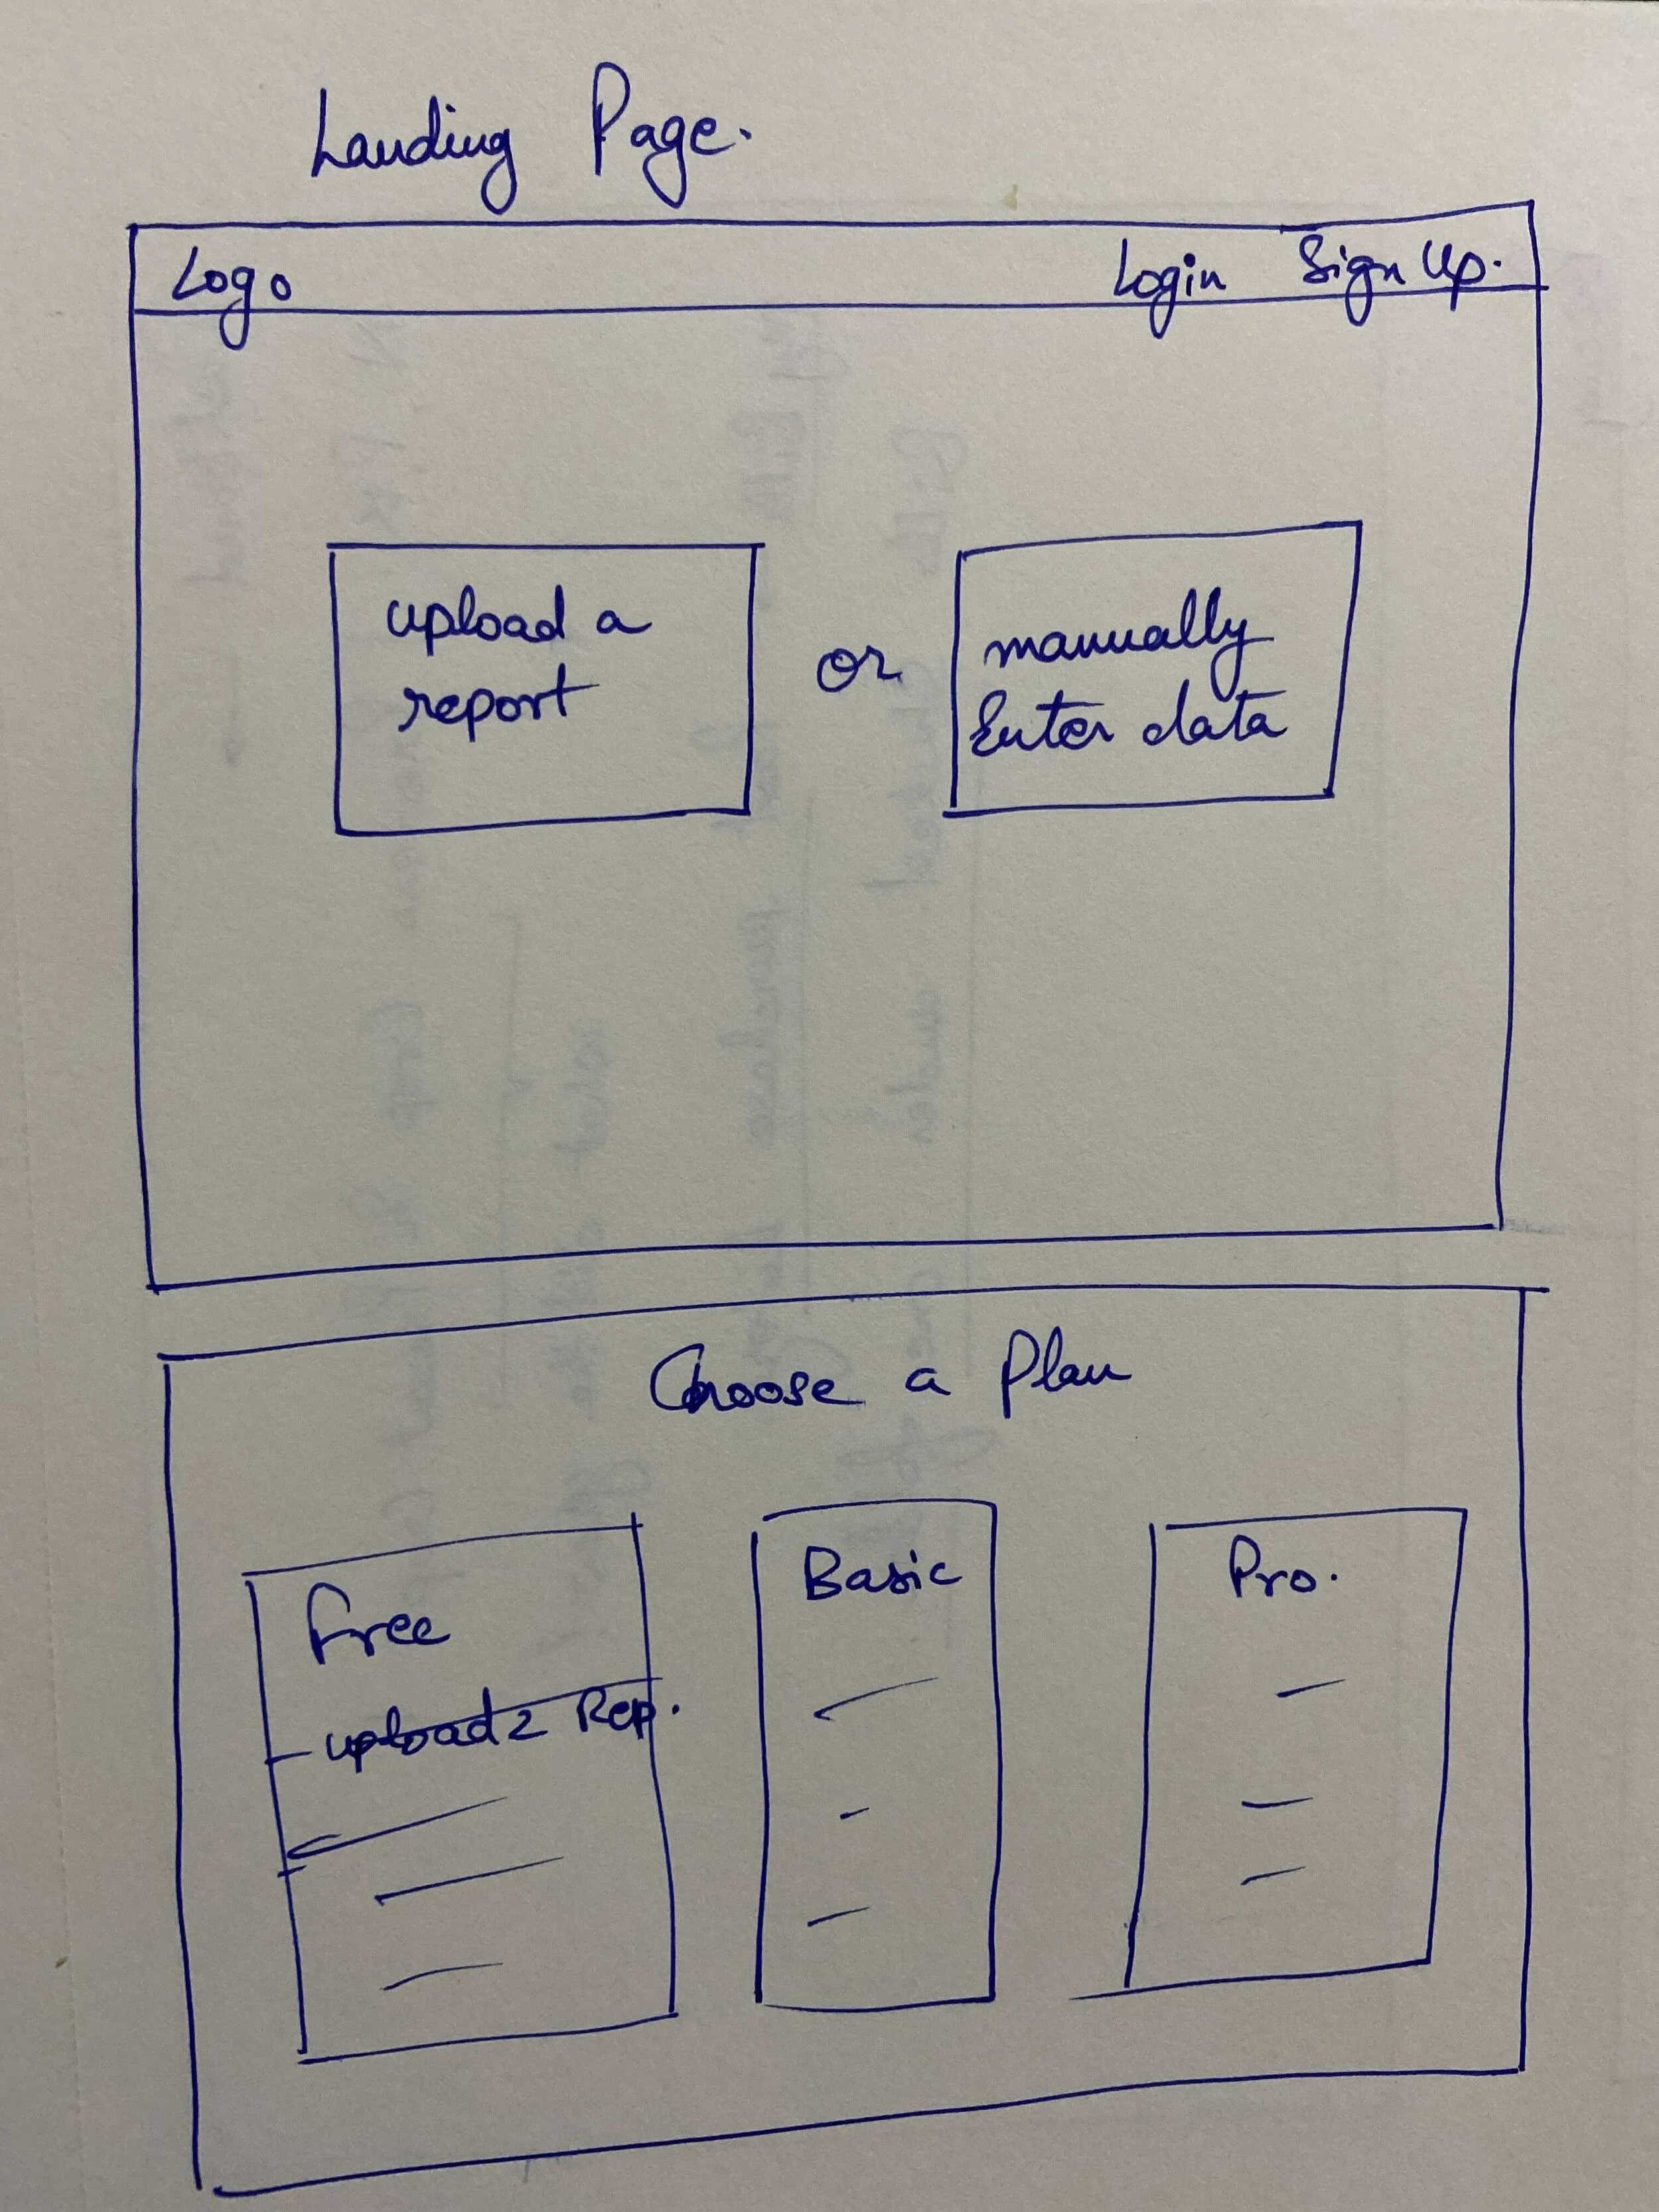

Onboarding Wireframe


Wireframes - Fertigo Mobile Application


Typography for Fertigo

Color Pallete for Fertigo
Defining icons for Fertigo

Team Informatica Ranch Logo
High-Fidelity Prototype Screens


Future Steps
To create precision purchase plans for all farm inputs.
Leverage our large pool of data:
To assist USDA in implementing Best Farm Management Practice's (BMPs)
Guide farmers to increase their soil quality in a sustainable way
My Learnings
1.) Working on a team project from home requires efficient collaboration, efficient communication, and efficient use of online collaboration tools.
2.) I learned the importance of keeping a calendar as it was important for others to know at what time slots I am availbale for a Zoom call.
3.) I discovered the importance of collaboration tools such as Mural and Miro for collaborative brainstorming, ideation, and making deliverables.
4.) As the mentor gave me the Manager's role, I faced many challenges and learned to overcome them. This what I learned :
The importance of listening to members' members' problems and acting on them instantly to resolve the issue and the importance of communicating in members' language.
For example, there was a big communication gap between the design team and the data scientist team.
This communication gap led to an argument between one of the designers and one of the data scientist.
As the deadline to submit the project was near, I had to intervene between their arguments and resolve them.
The process that I followed to resolve their differences with each other.
Step 1: I talked with them individually and tried to figure out what the problem was.
The problem was that the Data Scientist was unable to understand the deliverables sent by the design team.
Designers shared the deliverables like wireframes, Design flow, and low-fidelity prototypes with them in Adobe XD.
The data scientist had never used Adobe XD and had a problem understanding the fact that wireframes were not the final design.
The designer was angry at the fact that why the data scientist does not understand the correct dataflow.
Step 2: I brainstormed quickly to come up with a solution.
Being a former Computer Science student, I was able to empathize with the Data Scientist. As the Data Scientist is not aware of the design thinking process and software like Adobe XD, I converted the wireframes, and the user flows into a Data Flow Diagram that the Data Scientist can understand.
I called both of them together and pitched the idea of me being responsible for converting all the design deliverables into a format that data scientists will understand. From then, I communicated all the design work to the data scientist team.
We were finally back on track and went ahead to submit the project on time before the deadline.
5.) I had the opportunity to take the lead on the business model. While designing an efficient roadmap for commercialization, I had a chance to study the business and pricing models of different brands such as Priceline, Hotwire, Uber, and food delivery brands like Grubhub.
Studying such models and designing the business model for Fertigo, I learned:
The value of robust research that identifies the pains, gains, and jobs of the target customers. Further creating a Value Proposition Canvas that maps the possible Gain Creators, Pain relievers, and Services/Products.
Importance of creating an established channel that delivers all the services or the products to the customers. Also, it is crucial to identify how to build and maintain a strong customer relationship.
How to create a low-cost production plan by identifying the right Key Resources, Key Activities, and Key Partners.
How to create Revenue Streams and find the right pricing mechanism for each stream.