
AlertMe!
Scroll ↓

AlertMe! an interactive mobile application that makes the student aware of the time spent on social media and helps them to restrict and control their social media usage. It helps the students to combat social media addiction by making them aware through Alert-O-Meter. Alert-O-Meter showcases the severity of addiction and helps them to detox by giving them options to lock down selected apps for selected times and days.
or interact with the prototype below!
Click on the Sign-Up, or I already have an account button and start interacting with the prototype.
Project Details
My Role - UX Researcher and UX Designer
Project Duration - 3 months
Team - Hemil Gurjar, Abhijeet Saxena, Sathwik Ala
What was my task/work?
My role was to research social media addiction, conduct field research, ideate, perform usability testing, and prototype.
UX Methods used:
Contextual Inquiry, Affinity Diagramming, Empathy Mapping, User Personas, Storyboarding, Cognitive Walkthrough, Think-Aloud Usability Evaluation
Tools Used
Balsamiq
Adobe Illustrator
Adobe XD
My Research and Design Process
Research Stage
Why focus on Social Media Addiction? - The Process

Indiana University Grand Challenge

As a student of Indiana University, I accepted the IU's Grand Challenge on Responding to the Addictions Crisis. I decided to focus on Behavioral Addiction and according to my research:
Behavioral addiction is constant engagement in a particular behavior without knowing the catastrophic outcome that affects other domains of life.

There are different kinds of Behavioral Addiction:

Focusing on Social Media Addiction

Why Social Media addiction is challenging to address?
•Easy-access
•Lack of proper social media governance laws
•Many people are unaware of the effects of social media addiction
•Uncontrollable power and influence of social media
•Problematic Social Media Usage is not recognized as an addiction until recently
Harvard study on Social Media addiction


Target Users: Student
Why Students?

Target User Age Group
The target age group of students is 18 - 29.

Field Research
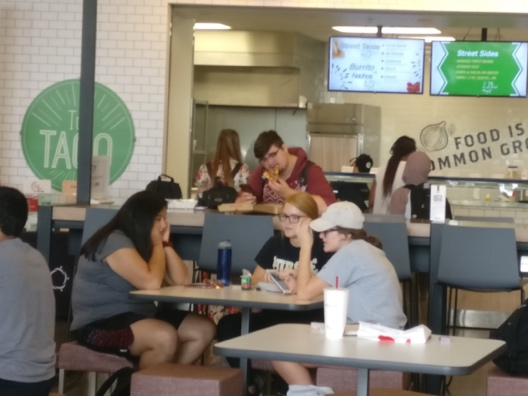
Observing Students:
I observed many individuals who are sitting alone, waiting in a queue, walking down the escalator, and also hanging out with a group of friends. The observed students mostly during lunch hours and evening hours on regular working days. The students whom we observed are 18 to 25 years old.
From these observations, I learned the behavior of people when they interact with social media. I also learned how people could use social media to avoid talking to others or kill time, even if it is for a short duration. I realized that people from different countries use different social media platforms, including international platforms like Facebook, Instagram, and local social media sites like Sina, Weibo. I realized that people frequently like to check the progress of the posts posted on social media, more than expected.


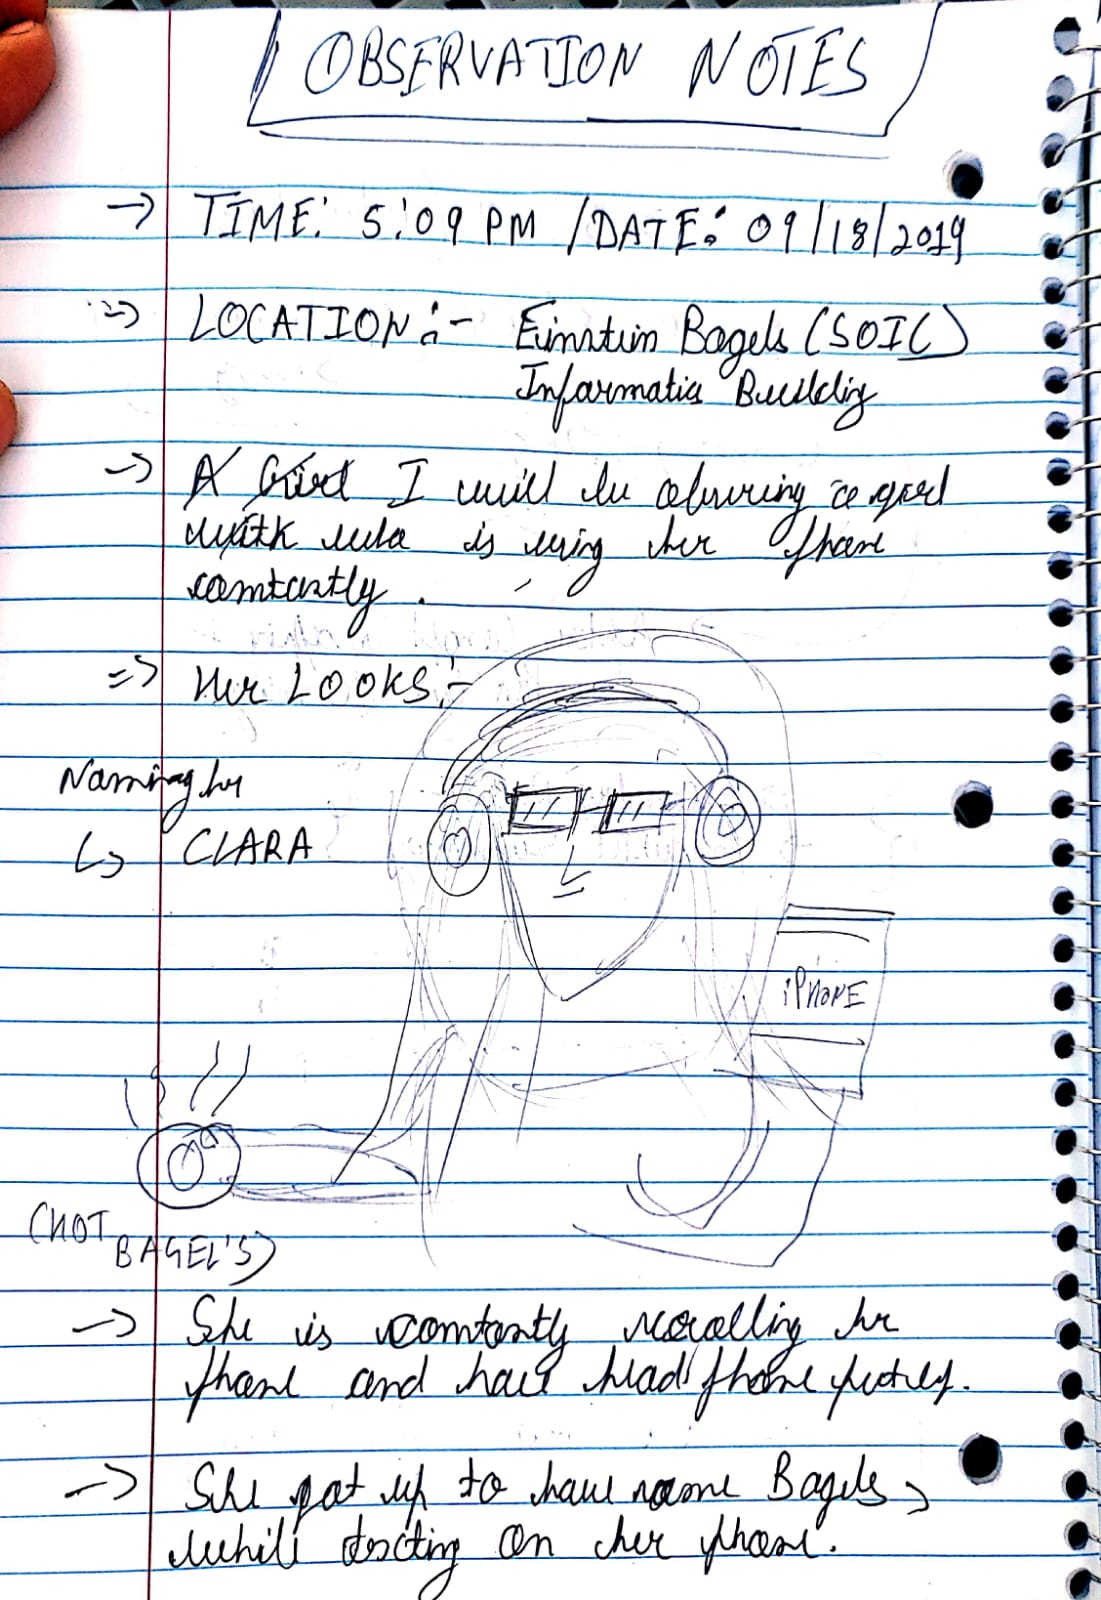
My observation notes.

Semi-Structured Interview
I conducted semi-structured interviews with Graduate and Undergraduate students on the IUPUI Campus to understand how and when these people turn to social media. Also, I attempted to understand how social media was affecting their studies, relationships with family and friends, etc.
I understood that people have different personalities in real life than their social media personalities, and people are more inclined towards the latter. Social media addicts find that these apps are an escape from reality into a better space.
I could obtain information about the addict's perspective regarding their usage and how they feel about it.We understood that social media addicts might sometimes realize their addiction and want to reduce the usage or avoid using it. Still, they keep falling back because of the lack of motivation or enough tools that help them.
Framing the problem statement:
Affinity Diagramming helps to gather critical insights and form a problem statement.


Problem Statement
How might we design computing technologies to deal with students of 18 -29 who are not aware of their social media addiction and the students who are already aware of their addiction?
Categorizing users into two types:
Aware of addiction and looking for help.

Unaware of addiction and not looking for help
Empathizing with the target user
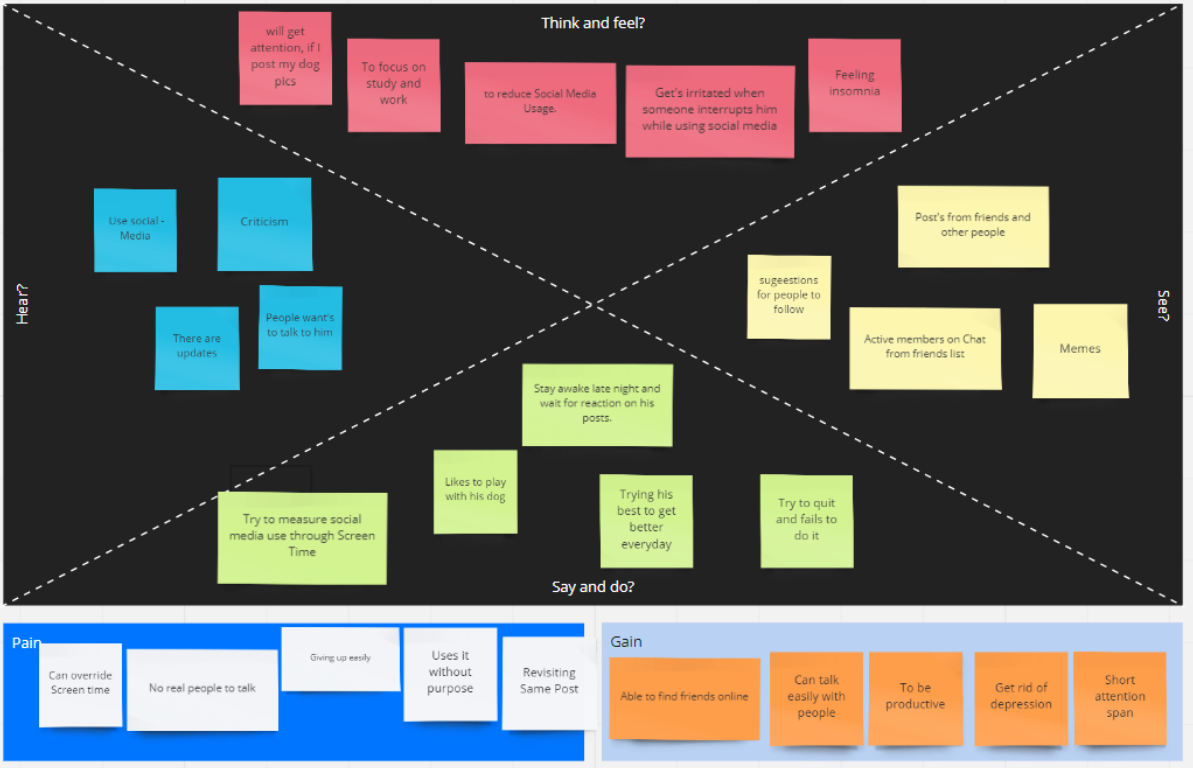
An empathy map helps to know about the user’s pain points, gains, and perspective on social media addiction.
Drawing out Scenarios


Sketching out the final concept - Prototype Stage
For the First Iteration of prototyping and user testing, I chose paper prototyping because it is a very flexible method. This method enabled me to drag the users away from the distraction of notifications on mobile screens while testing. Moreover, it helped me understand how the user navigated the application, and I was able to identify the confusion in the flow.
First Iteration: Pen Sketch
While testing this paper prototypes, I discovered many problems with the design. At first, for the landing page, I designed some graphs where users can track their usage. Furthermore, the charts provided users with the option to drill down their usage.
This idea didn't work well as I was overwhelmed with the data the application was pushing.
Based on the experience with the design, I decided to make the interface clean and in multiple layers so that it becomes easy to understand.


Second Iteration: Wireframes
After that, for the second iteration, I used Balsamiq for making neat wireframes and then printed them to test them with the users. I included the key performance indicators in all the screens and made the interface look simple.


Final Iteration: High Fidelity Prototype
I created high-fidelity user interfaces using Adobe Illustrator.The reason I proceeded with Illustrator was the flexibility the tool provided me to design. To convert the mock-ups into prototypes, I used Adobe XD as transferring files between two apps was very easy.

A light and a straightforward dashboard containing three cards that highlight vital information and buttons on the cards allows the user to get more details.

Addict - o - Meter shows the user severity of social media addiction through scores and colors. Generally, users are classified as addicts if their usage is more than 45 minutes per day.

Daily usage of Social Media screen shows minutes spent on social media today and yesterday through easy-to-understand line graphs. Further, users can toggle between daily, weekly, and monthly views. It also shows the time spent on all social media apps individually.

Daily Application Usage Screen shows time spent on selected social media applications and shows vital information in Key Performance Indicators(KPIs).

Reduce usage allows users to set time and day limits on their usage of social media. Users can also select passes to use social media even after the time and day limit of social media usage has exceeded.
Reflection from Usability Evaluation
After designing the high-fidelity prototypes, I conducted Cognitive Walkthrough, Heuristics Evaluation, and Usability evaluation using the think-aloud protocol. Each of the evaluation techniques helped in determining the review of all the user experience aspects. In the assessment of the application, I tried to ask questions which helped me identify not only the cosmetic issues but also usability issues and other features which the users might expect to find.
In User evaluation, I chose three critical tasks "Understanding usage graphs," "Understanding Addict-O-Meter," and "Understanding restriction and passes," which was imperative to the usability of the application.
During the evaluation phase, some problems emerged with the design. For all the evaluation methods I used, i.e., Cognitive Walkthrough, Heuristic Evaluation, and Think-Aloud, the following issues were very prominent.
1. The graphs which show the usage statistics are confusing.
2. The purpose and usage of Addict-O-Meter is not clear
3. The instructions about restricting the users' social media usage time on the application are not clear
4. Interface for the navigation into different pages of the application is confusing. The above fundamental problems were evident from all the evaluations.